


Moving Beyond The Design Storm: Rethinking How We Model Rainfall To Better Understand Where Flood Risk Actually Lives
In a large regional flood risk study, LimnoTech set out to build something better than a single, uniform “design storm.” Today’s era calls for a data-driven, spatially variable rainfall method that treats storms the way they actually behave, which is unevenly.
By Brendan Cousino, Principal and Civil and Environmental Engineer, Carrie Turner, Principal and Environmental Engineer, and Greg Ewing, Hydroinformatics and Environmental Engineer (Ann Arbor, MI)
October 28, 2026
Key Takeaways to Better Understand Flood Risk
- LimnoTech has developed an approach to spatially vary synthetic rainfall
- Methodology relies on aggregating understanding from a collection of historic rainfall events
- Approach allows for systematic investigation of flood vulnerability throughout a large regional study area
- Approach is flexible and generalizable
- Value of spatially variable rainfall analysis ultimately lies in giving decision-makers and the communities they serve a clearer, more accurate picture of where their system poses a flood risk
How a Data-Driven Approach to Spatially Variable Rainfall is Changing the Way We Plan for Urban Flooding
Urban flooding doesn’t follow the tidy assumptions engineers have long relied on for planning. A storm that overwhelms one neighborhood’s storm sewers might barely dampen the pavement ten miles away. Yet, for more than a century, the standard tool for testing and sizing flood infrastructure has been a single, uniform “design storm” applied evenly across an entire service area. That approach built the modern wastewater and stormwater systems we depend on today. But as study areas grow larger, climate patterns shift, and available resources to address flooding are strained, communities are demanding more precise answers about where they’re vulnerable. The idea of uniform rainfall is starting to show its age.
In a large regional flood risk study, LimnoTech set out to build something better: a data-driven, spatially variable rainfall method that treats storms the way they actually behave, which is unevenly.
The Complexity Beneath Urban Flooding
Flood risk is not one number. It’s the product of overlapping systems and factors such as aging sewer infrastructure, varied land use and topography, and a climate that no longer behaves like the historical record used to design against it. Analyses assessing flood risk at larger spatial scales are becoming more common than what has been required historically. Reasons include expanding urban and suburban area footprints that require extending sewer service over larger areas and the formation of regional utilities to ensure cost-effective investments and management of shared infrastructure assets.
A regional study area means grappling with how dozens of hydrologic and hydraulic (H&H) components interact across vastly different scales. A single service area can span multiple counties, watersheds, and sewer types, each behaving differently under stress. Rainfall is one of the most consequential components of these studies. How a system responds to variable rainfall is central to understanding regional flood risk.
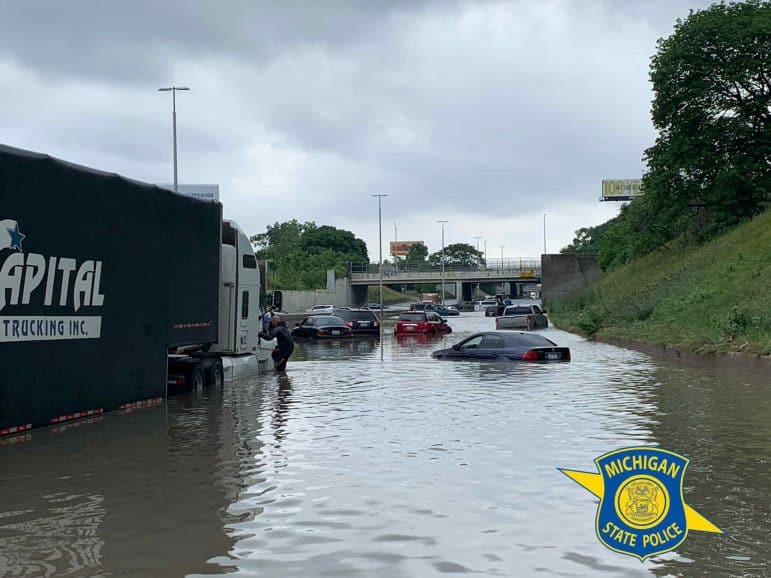
However, working with new degrees of freedom in the rainfall inputs introduces new uncertainties. Add in the uncertainty that the National Oceanic and Atmospheric Administration (NOAA) itself acknowledges in the long-standing Atlas 14 rainfall frequency estimates, as well as the forthcoming Atlas 15, which will account for a changing climate. The target that engineers are designing toward is, quite literally, moving.
This complexity is not new, but its effects are now more visible. As flood risk studies expand from individual sewersheds to entire regions, assumptions that worked at smaller scales can obscure the information communities need most. That is, understanding which areas are most vulnerable, and why.
Why We’ve Relied on Uniform Rainfall for So Long
The assumption of uniform rainfall starts with a design storm. This concept did not appear overnight. It grew out of successive generations of data and technology, each building on the last. In the mid-to-late 1800s, the Rational Method provided a way to use metered rainfall data to estimate peak discharge from a watershed. It was a breakthrough for its time, though it could only describe a peak flow rate, not how a flood event actually unfolds. The buildout of the national rain gauge network in the 1930s and 1940s gave engineers denser data on rainfall intensity over shorter durations, which fed into TP-40 (Technical Paper 40, Rainfall Frequency Atlas of the United States, USDA SCS, 1961), the country’s first standardized source of rainfall frequency estimates. That single advance gave the profession a common language. A project could be designed to withstand a 10-year, 1-hour storm, and every agency, consultant, and reviewer understood exactly what that meant.
TR-55 (Technical Release 55, Urban Hydrology for Small Watersheds, USDA NRCS), introduced in 1975 and revised again in 1986, added synthetic rainfall distributions that let engineers move from a single depth and duration value to a full hydrograph. By the early 2000s, hydrologic and hydraulic (H&H) modeling platforms like the Storm Water Management Model (SWMM) made it possible to simulate entire collection systems rather than limited points of interest.
The design storm concept was never wrong. But it was built for a different kind of question than the one many of today’s regional studies are asking.
Each of these tools represented real progress. But they all share the same underlying simplification, which is to take one rainfall value, typically derived from a single gauge or a point rainfall estimate, and apply it evenly across the whole study area. That simplification was a reasonable response to the data and computing constraints engineers faced at the time, and it gave the industry something valuable. The approach created a shared vocabulary for describing infrastructure performance, a conservative margin of safety, and an efficient way to design projects without the burden of endless computation.
The design storm concept was never wrong. But it was built for a different kind of question than the one many of today’s regional studies are asking.
Where the Old Approach Falls Short
The trouble begins when the question changes. Sizing a single pipe is one thing. Identifying where flood risk concentrates across a large, varied region, spanning multiple watersheds, land uses, and sewer types, is another problem entirely.
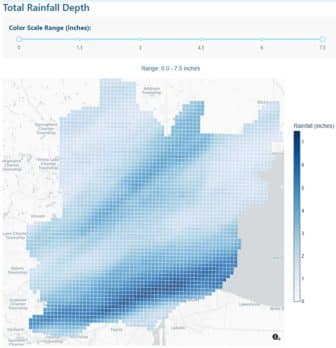
Real storms are stochastic. Their intensity and duration shift continuously across space, sometimes dramatically within just a few miles. In one large regional storm we studied, roughly half of the affected area received less than a 5-year rainfall depth. At the same time, the most intense pockets exceeded a 1,000-year event, all within the footprint of a single storm system. If you apply a uniform design storm across that same landscape, you will either overstate risk where it doesn’t belong or understate it and mislocate it, exactly where it matters most.
For any regional study meant to guide where limited flood risk investment should go, that is a serious blind spot. Where the most intense rainfall falls is itself a determining factor in flood risk, and a uniform storm, by its very construction, cannot tell you where that will be.
A More Accurate Way to Model Rainfall
Rather than throw out the design storm framework, our team asked a different question. What if we built the rainfall input from what storms actually do, instead of from a single gauge assumption?
The answer draws on gridded Quantitative Precipitation Estimates, a mature technology that blends radar and gauge measurements into a high-resolution rainfall record, often at roughly one-kilometer grid spacing and sub-hourly time steps.
In one large-scale application of this approach, our team analyzed a multi-year, gauge-adjusted radar rainfall record covering several thousand grid cells at 15-minute resolution, amounting to hundreds of millions of individual data points. From that record, we identified and characterized more than 400 distinct historic storm events.
A few consistent patterns emerged from that analysis:
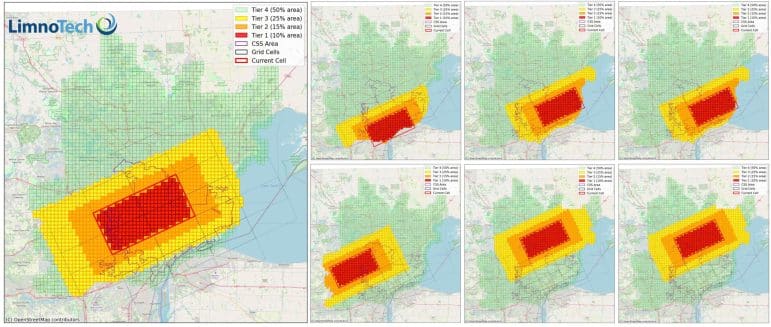
- Storm core size. The most intense band of rainfall in a typical large storm tends to cover roughly 10 percent of the study area.
- Shape and orientation. That intense core generally follows a 2-to-1 shape, oriented roughly 67 degrees from due east, a signature of how these storms tend to move through the region.
- A tiered rainfall structure. Instead of one uniform value, we developed four concentric tiers radiating outward from the storm core. The innermost tier is set at the traditional design storm depth, and the surrounding tiers taper down based on the patterns observed across the historic record.
The result is what we call a spatially variable design storm suite. Rather than one uniform event, it is a set of storms in which the intense core is systematically relocated across the study area, so that every part of the system is tested against the highest tier of rainfall in at least one simulation.
This is a deliberate middle path, not an all-or-nothing swap. A fully uniform storm risks over- or undersizing infrastructure and misses spatial variability altogether. A fully stochastic approach, essentially a systematic random method to locate storms in the study area, may be more statistically robust. Still, it demands far more computing time than most project budgets or schedules allow. It also offers no guarantee that every part of the system gets meaningfully tested or tested in the same way. Systematically varying the storm core across a defined set of permutations captures much of the realism of a stochastic method while keeping the number of required simulations to something a project team can run, interpret, and defend.
This approach has moved beyond a research exercise. We have applied it as the analytical backbone of large, multi-jurisdictional flood risk studies spanning several watersheds, multiple counties, and a mix of combined and separated sewer systems, each responding differently to rainfall and requiring its own analytical treatment.
Applying spatially variable rainfall at that scale lets a project team systematically stress test the collection system and identify where flood vulnerability actually concentrates, rather than assuming it is spread evenly across a service area. That, in turn, helps us focus on a more detailed engineering evaluation and allows decision makers to prioritize funding for the places most likely to benefit.
What’s Next?
The framework is intentionally flexible. Rainfall can be varied spatially, temporally, or both. Tier structures and core shapes can be recalibrated to different regions or storm climatologies; and because the underlying data source (NOAA’s radar-gauge products) is publicly available, the approach doesn’t require a proprietary vendor contract to replicate elsewhere.
That flexibility opens doors beyond a single study’s initial scope. The same spatially resolved understanding of flood risk can support asset-level testing of individual infrastructure components, feed into digital twin models of a collection system for ongoing operational decision making and inform optimization of capital improvement project sequencing.
As large-scale flood risk studies move through the planning process toward funding decisions, the quality and spatial precision of the underlying risk analysis directly shape which communities get prioritized for investment.
And there’s a bigger stake underneath all of it. It is how flood-risk dollars, federal, state, and local, get allocated. It also creates a foundation for more equitable decision-making. Using spatially explicit risk data ensures environmental justice considerations are part of how projects get prioritized and not an afterthought layered on at the end. As large-scale flood risk studies move through the planning process toward funding decisions, the quality and spatial precision of the underlying risk analysis directly shape which communities get prioritized for investment. A method that can actually distinguish where flood risk is highest, rather than assuming it’s spread evenly, is a method that supports better-targeted, more defensible funding decisions
Bridging the Technical and the Human
None of this advanced analysis matters if it stays inside a model. The value of spatially variable rainfall analysis ultimately lies in giving decision-makers and the communities they serve a clearer, more accurate picture of where their system poses a flood risk. That requires more than good data and good modeling. It requires translating technical analysis and modeling into something communities can see, understand, and act on.
This is the role LimnoTech aims to play in large-scale flood risk studies. We are not just building a more sophisticated rainfall input. We are making sure the resulting insight actually reaches the people making decisions about where flood-risk investment goes next. That’s the engineers, agency partners, and residents whose neighborhoods are on the map, and whose homes are on the line. This approach, coupled with leveraging community input and engagement, allows us to validate people’s experience with flooding, elevating anecdotal information into science-backed information that results in flood resilience plans and solutions that are technically sound, cost-effective, and positively impact communities.
This article delves into the lessons we’ve learned about leveraging the latest science and engineering to better understand the triggers that lead to flooding under a changing climate and a static infrastructure system. It is the third in a series of articles authored by the LimnoTech team on flood resiliency planning and adaptation. In our next two web articles, we will discuss how we use these innovative approaches to identify and understand system vulnerabilities to flooding, and the resilient solutions that can be applied to mitigate those flood vulnerabilities.
Links to the published articles in this series are provided below, along with upcoming articles that will go deeper into how we help communities develop resilient flood solutions.
- Article No. 1 – Creating flood resilient communities
- Article No. 2 – Listening and soliciting input and feedback from the communities we work with, affected by flooding
- Article No. 3 – Leveraging the latest science and engineering to better understand the triggers that lead to flooding under a changing climate and a static infrastructure system
- Article No. 4 – Pinpointing critical vulnerabilities in a community’s infrastructure assets using modeling and monitoring (anticipated in Fall 2026)
- Article No. 5 – Developing and maximizing resilient solutions that incorporate natural elements to address system vulnerabilities and provide community co-benefits (anticipated in Winter 2027)
Reach out to Brendan Cousino (bcousino@limno.com), Carrie Turner (cturner@limno.com), or Greg Ewing (ewing@limno.com) to learn more about how LimnoTech supports communities with resiliency planning and flooding-related challenges and urban wet weather issues.
Follow us on LinkedIn and check the Insights & Perspectives page on our website for more information, updates, and new articles.
Brendan Cousino, PE, is a Principal and Senior Civil and Environmental Engineer at LimnoTech with over 24 years of experience spanning both public sector and consulting roles. His work focuses on integrating engineered and nature-based solutions to enhance community and infrastructure resilience with ecosystem-based restoration. Brendan leads multidisciplinary teams on projects ranging from shoreline protection and coastal restoration to CSO and municipal stormwater compliance, and regulatory permitting. He helps clients navigate complex regulatory frameworks while advancing projects that deliver co-benefits for water quality, habitat restoration, and community revitalization. He brings technical expertise in hydrologic, hydrodynamic, and sediment transport processes across riverine, estuarine, and coastal systems. His work often includes developing and applying advanced numerical models to evaluate flood hazard risks, wave dynamics, storm surge impacts, and sediment stability under existing and future conditions, including climate-driven variability.
Carrie Turner, PE, is a Principal and Senior Water Resources Engineer at LimnoTech, specializing in developing affordable and sustainable solutions for wet weather pollution-related issues. Most of Carrie’s 25+ years of experience with LimnoTech have been assisting municipal and nongovernmental organizations in solving their most vexing water resource issues by leveraging existing data, developing and implementing targeted sampling strategies, and applying hydraulic, hydrologic, and water quality models to identify cost-effective and scientifically sound solutions. She also has extensive experience using her chemistry background to design and implement innovative water and wastewater sampling programs, including wastewater-based epidemiology projects collecting and analyzing samples in the Detroit area for the virus that causes COVID-19.
Gregory Ewing, PhD, joined LimnoTech in June 2025 as a Hydroinformatics and Environmental Engineer. He brings expertise in hydrologic modeling, web systems, and software development for real-time decision support. His work focuses on advancing decision-making in water resources through web-based tools and frameworks. During his doctoral research at the University of Iowa, Greg developed a general framework for web-based hydrologic modeling. He explored novel methods to evaluate the performance and preference characteristics of decision algorithms applied to stormwater and sewer collection systems. His project experience includes developing real-time control systems, model-driven analysis tools, and user-focused simulation platforms that support adaptive infrastructure management.